
LASSO and RIDGE Linear regressions & L1 and L2 regularizations - the impact of the penalty term
|
|
Teaching (Today for) Tomorrow: Bridging the Gap between the Classroom and Reality 3rd International Scientific and Art Conference |
|
|
| Section - Education for |
Paper number: |
Category: Original scientific paper |
Abstract |
|
|
|
Key words: |
Introduction to
linearSelf-compassion reflects being kind and understanding toward oneself amid life difficultiesregression (Neff, 2003a). Through self-compassion one can restrain from self-criticism, over-identification with the experienced difficulties and isolating from others. Self-compassion is usually operationalized as a multidimensional construct that entails self-kindness, mindful awareness of painful experiences and recognizing that difficulties are part of the shared human experience (Neff, 2003a). Studies have confirmed that self-compassion relates to higher subjective and psychological well-being (e.g., Neff, 2003b; Tran et al., 2022). Positive psychology in education recognised self-compassion as a positive correlate of students’ stress resilience (Egan et al., 2021; McArthur et al., 2017), adaptive coping (Ewert et al., 2021; Neff, 2005) and various indicators of well-being (Fong & Loi, 2016; Hollis-Walker & Colosimo, 2011; Rahe et al., 2022). Thus, it seems important to study factors that promote self-compassion, especially among students who are preparing for stressful and demanding professions such as preschool teaching.
Previous studies linked self-compassion with mindfulness (Egan et al., 2021; Neff, 2003a; Tran et al., 2022). Mindfulness reflects a particular way of focusing attention and awareness on a present moment with a non-judgmental and non-reactive attitude towards ongoing experiences (Baer et al., 2006; Brown & Ryan, 2003). Although mindfulness is often studied as a momentary state that can be reached through meditative practice it can also be studied as a multifaceted disposition, i.e., a general tendency to be more mindful in everyday life (Brown & Ryan, 2003). Being mindfully aware, non-judgemental and non-reactive to all, including painful present-moment experiences, allows one not to get overwhelmed by or avoidant of them. This implies mindfulness as a necessary precursor of self-compassion (Biehler & Naragon-Gainey, 2022; Neff, 2003a). Previous studies found that self-compassion was positively related to either all facets of mindfulness (Hollis-Walker & Colosimo, 2011) or some of the facets of mindfulness (McArthur et al., 2017), with total mindfulness being consistently positively associated with self-compassion (Egan et al., 2021; Hollis-Walker & Colosimo, 2011; Martinez-Rubio et al., 2023; Tran et al., 2022).
Previous studies also related self-compassion with emotional intelligence (EI) (Di Fabio & Saklofske, 2021; Heffernan et al., 2011; Neff, 2003b; Şenyuva et al., 2013). EI is a part of social intelligence and refers to positive emotional resources and adaptive emotional functioning (Schutte & Loi, 2014). EI can be conceptualized twofold, as a trait (e.g., Petride & Furnham, 2000; Wong & Law, 2002), or as an ability (Mayer et al., 2004). There are several dimensions of trait EI, but the most common operationalization includes dimensions of perceiving and understanding emotions in self (SEA), perceiving and understanding emotions in others (OEA), regulation of emotion (ROE) and use of emotion for self-motivation (UOE) (Wong & Law, 2002). Previous studies found that individuals with higher levels of EI have greater mental health (Martins et al., 2010), better relationships with others (Lopes et al. 2004), as well as higher well-being (e.g., Schutte & Malouff, 2011) and flourishing both in general population (Du Plessis, 2023) and student population (Pradhan & Jandu, 2023; Zewude et al., 2024).
Self-compassion may also be related to EI since self-compassion entails recognizing and transforming painful experiences into self-kindness and self-understanding (Neff, 2003a). Overall trait EI was found to be consistently positively related to self-compassion (DiFabio & Saklofske, 2021; Heffernan et al., 2011; Thomas et al., 2024), while the studies of the relationship between specific EI dimensions and self-compassion are somewhat scarce. To our knowledge, only one such study was conducted and found that specific dimensions of EI, i.e., self-management and self-motivation, were positively associated with all components of self-compassion (Şenyuva et al., 2011).
Based on the above presented, it seems that there is a lack of studies that examine the role of specific EI dimensions in self-compassion as well as their mediating role in the relationship between mindfulness and self-compassion. Mindfulness was found to be related to EI both on overall (Baer et al., 2006; Brown & Ryan, 2003) and at the specific EI dimensions level (Cheng et al., 2020; Bao et al., 2015; Park & Dhandra, 2017). Even more, mindfulness was suggested as a factor that may encourage accurate perception of emotions, development of emotional regulation, and more adaptive emotional functioning (Park & Dhandra, 2017). In other words, mindfulness may lead to higher EI, and higher EI may lead to positive outcomes, such as higher self-esteem (Park & Dhandra, 2017). Based on this, it may also be posed that higher mindfulness would lead to higher EI, which would lead to higher self-compassion. However, the mediating role of EI in the relationship between mindfulness and self-compassion was not investigated.
ObjectivesOLS)
The first aimpurpose of thislinear studyregression wasanalysis is to examinedetermine the rolebest-fitting line that accurately reflects the data by minimizing the sum of mindfulnesssquared residuals, using the ordinary least squares (OLS) method. This relationship is described by the regression equation Y = a + bx, which can also be expressed as Y = β0 + β1x. In this equation, Y represents the dependent variable, β0 (or a) is the constant (intercept), β1 (or b) is the slope, and EIx dimensionsis inthe self-compassion.independent variable.
Similarly, when using multiple predictors (independent variables), the equation can be expressed as Y = β0 + β1x + β2x + ... + βnx. By applying this regression equation, we can calculate the estimated value of the dependent variable for each new value of the predictors.
The slope of the regression line indicates its predictive power; a steeper line suggests better predictions. The secondformula aimfor wascalculating the slope (b) is: b= ![]() On the regression line, we find the estimated values of the dependent variable, while the difference between the actual values (y) and the estimated values (
On the regression line, we find the estimated values of the dependent variable, while the difference between the actual values (y) and the estimated values (![]() ) along the line is called the residual, defined as:
) along the line is called the residual, defined as:
e = (y-![]() ). The purpose of defining the regression line is to
). The purpose of defining the regression line is to examineminimize these residuals; thus, a smaller difference between the mediatingactual roleand estimated values is desirable.
In regression analysis involving two variables, the sums of EIsquares dimensionsprovide ina clear definition of their relationship. If the relationshipregression line perfectly fits the data points, the sum of squares would equal zero. Linear regression analysis examines the relationships between mindfulnessdifferent sums of squares (SS):
· SSR (sum of regression squares) = ∑ (![]() )2 This measures the squared differences between the estimated values and
)2 This measures the squared differences between the estimated values and self-compassion.the Themean hypothesesof y,
· Total Sum of Squares SST = ∑ (![]() )2 i.e. the squared sum of the differences between the observed value of the variable y and
)2 i.e. the squared sum of the differences between the observed value of the variable y and researchits questionsarithmetic weremean as
· and the Residual sum of squares SSE = ∑ (![]() which represents the squared differences between the observed and estimated values of y.
which represents the squared differences between the observed and estimated values of y.
H1:Lastly, Mindfulnesswe isdefine bivariatelythe coefficient of determination (1a)R²) andas uniquelyfollows: R2=![]() This coefficient indicates the proportion of the total variability in the dependent variable that can be explained by the independent variables. An alternative expression for R²=
This coefficient indicates the proportion of the total variability in the dependent variable that can be explained by the independent variables. An alternative expression for R²= ![]() (
(1b)compare associatedNelson, withBiu self-compassion.& Onu, 2004).
H2:Figure Overall1 emotionalshows intelligencethis is positively associated with self-compassion.
H3: Mindfulness is bivariately associated with EI dimensions, i.e., SEA, OEA, ROE, UOE.
H4: EI is the mediator between mindfulness and self-compassion: Higher mindfulness leads to higher EI, which in turn leads to higher self-compassion.
RQ1: Which EI dimensions, i.e., SEA, OEA, ROE, UOE are bivariatelygraphically (1a)an andexample uniquelyof (1b)a associatedstudy with self-compassion?
RQ2: Which EI dimensions, i.e., SEA (2a), OEA (2b), ROE (2c), UOE (2d) act as parallel mediators inon the relationship between mindfulnesshours of practice playing the piano and self-compassion?
Method
Participants and procedure
161 female studentsnumber of the Faculty of Teacher Education, University of Zagreb, studying early and preschool education, participatedmistakes in the research (M = 25.79 years; SD = 6.42) by voluntarily and anonymously filling out the paper-pencil questionnaire during the regular academic semester.
Measures
Mindful Attention Awareness Scale (MAAS, Brown & Ryan, 2003) was used to measure disposition to mindful attention and awareness. MAAS consists of 15 items (e.g., “I find it difficult to stay focused on what’s happening in the present”, reversed) which participants rated using a 6-point Likert scale ranging from 1 (almost always) to 6 (almost never). The total score was calculated as a mean of all item ratings with higher results indicating higher levels of mindfulness. The scale was previously used in a Croatian sample and demonstrated good psychometric characteristics (Kalebić Jakupčević, 2014).
The Wong and Law Emotional Intelligence Scale (WLEIS, Wong & Law, 2002) was used to measure four EI dimensions, i.e., self-emotion appraisal (SEA, e.g., I really understand what I feel), others’ emotion appraisal (OEA, e.g., I have good understanding of the emotions of people around me), use of emotions (UOE, e.g., I am a self-motivated person), regulation of emotion (ROE, e.g., I am able to control my temper and handle difficulties rationally). All 16 items were rated on a 7-point Likert scale ranging from 1 (strongly disagree) to 7 (strongly agree). The total average score for each WLEIS subscale was used as an independent indicator of each EI dimension. A higher result on each WLEIS subscale indicates a higher level of that EI dimensions.
The Self-Compassion Scale–Short Form (SCS–SF, Raes et al., 2011) was used to measure six components of self-compassion, i.e., over-identification (e.g., When I fail at something important to me I become consumed by feelings of inadequacy, reversed), self-kindness (e.g., I try to be understanding and patient towards those aspects of my personality I don’t like), mindfulness (e.g., When something painful happens I try to take a balanced view of the situation), isolation (e.g., When I’m feeling down, I tend to feel like most other people are probably happier than I am, reversed), common humanity (e.g., I try to see my failings as part of the human condition) and self-judgement (e.g., I’m disapproving and judgmental about my
own flaws and inadequacies, reversed). All 12 SCS-SF items were rated on a 5-point Likert scale ranging from 1 (almost never) to 5 (almost always). A total self-compassion score was calculated as a mean of all subscale scores but omitting mindfulness subscale items, in order to avoid an artificial increase of correlation between the constructs of mindfulness and self-compassion, which is a common practice in such cases (e.g., Martínez-Rubio et al., 2023). A higher total result indicates a higher level of self-compassion.
Results
Descriptive statistics, correlations among the study variables, and Cronbach’s alpha
Descriptive statistics, bivariate correlations and Cronbach’s alphas are detailed in Table 1. The mean results showed that students reported moderate levels of mindfulness, both overall EI and specific EI dimensions as well as moderate levels of self-compassion. Mindfulness was positively bivariately correlated with self-compassion thus supporting Hypothesis 1a. Overall EI was bivariately positively associated with self-compassion, in line with Hypothesis 2. Mindfulness was also positively bivariately correlated with three of four EI dimensions, i.e., SEA, ROE and UOE, thus partially supporting Hypothesis 3. Regarding Research question 1a, all EI dimensions, i.e., SEA, ROE and UOE except OEA were positively bivariately correlated to self-compassion.playing)
Table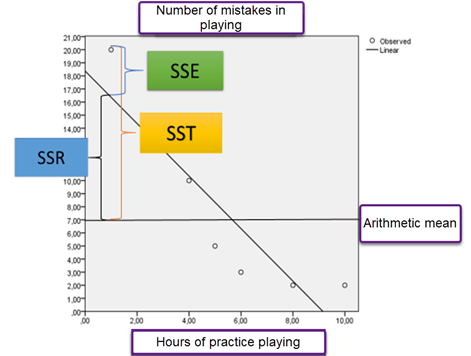
|
|
|
|
|
|
|
|
|
|
|
|
|
|
|
|
|
| 1 |
|
|
|
|
|
|
| - |
|
|
|
|
|
|
| in
|
|
|
|
|
|
|
|
|
|
|
|
|
|
|
|
|
|
|
|
|
|
|
|
|
|
|
|
|
|
|
|
|
|
| ||||
|
|
|
|
|
|
|
|
|
|
|
|
|
|
|
|
|
|
|
|
|
|
|
|
Note. *p < .05; **p < .01; ***Self-compassion scale with mindfulness items (item 3, item 7) omitted.OLS
RegressionFrom analysis
Avalues of the regression parameters (R2, R2adjust, β...) we conclude about the validity and power of the predictive regression model. However, the values of linear regression analysis was(OLS) performedstatistics withare mindfulnesssignificantly affected by e.g. sample size, collinearity/multicollinearity, autocorrelation of residuals, linear dependence, outliers... From the above, LASSO and fourRIDGE EIlinear dimensionsregressions asare predictorsa kind of control and self-compassion as criteria (Table 2). Together predictors explained 42%upgrade of theOLS variancelinear in students’ self-compassionregression (F5,155Marquardt =& 22.69,Snee, p1975; <Hoerl, 0.001)& Kennard, 1975, Irandoukht, 2021). In line with Hypothesis 1b, mindfulness was a uniquely significant predictor of self-compassion. Regarding Research Question 1b, only EI dimensions of SEA, ROE and UOE were shown as uniquely significant predictors of self-compassion. Variance Inflation Factor (VIF) value for EI dimensions and self-compassion ranged from 1.13 to 1.64 indicating that all values are smaller than 10, meaning that there is no multicollinearity in the independent predictors.
Table 2
Regression analysis results with self-compassion as a criteria.
|
|
|
|
|
|
|
|
|
|
|
|
|
|
|
|
Note. β = standardized beta coefficients; *p < .05; **p < .01.
MediationLASSO analysisand RIDGE regressions
LASSO regression (Least Absolute Shrinkage and Selection Operator) is L1 regularization. The resultspurpose of LASSO regression is to find a balance between the simplicity of the mediation analyses with EI dimensions of SEA, ROEmodel and UOE,its asaccuracy parallelby mediatorsadding betweena mindfulnesspenalty andterm self-compassion are displayed in Table 3 and Figure 1. In line with Hypothesis 4, dimensions of EI mediatedto the relationshipexisting betweenregression mindfulnessmodel. andSuch self-compassion.an Inapproach regard to Research Question 2, mediation analysis showed a partial mediation of mindfulness on self-compassion through the three EI dimensions, i.e., SEA (2a), ROE (2c) and UOE (2d) that acted as parallel mediators. The direct relation between mindfulness and self-compassion remained significant indicating the mediation was partial. Higher mindfulness fosters students’ self-compassion both directly, and indirectly via higher SEA, ROE and UOE. All mediators hadindicates a significant indirect effect on self-compassion. Although, UOE had the highest ratio of indirect to total effect (.19), specific indirect effect contrast analysis showed that the indirect effect of specific EI dimensions does not significantly differ from each other as shown in bootstrap method (with 5,000 bootstrap samples) at 95% confidence intervals.
Figure 1
Mediating rolereduction of the threeregression EIcoefficients, dimensionseven down to the value of zero (0). Originally, LASSO regression was created in the relationship between mindfulness and self-compassion
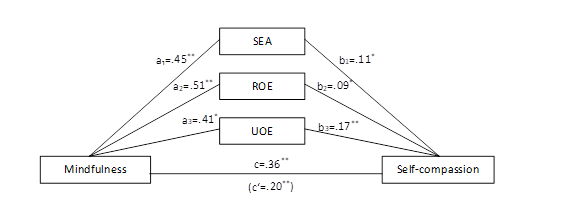
Note. SEA = self-emotional appraisal, ROE = regulationfield of emotion,geophysics, UOEalthough =it usegained ofmore emotion;popularity non-standardizedfrom coefficients;the *pauthor <Tibshirani .05;(1996), **pwho <gave .01.it aits relationship between predictor and mediator, b relationship between mediator and criteria, c total effect, c’ direct effect. name.
Table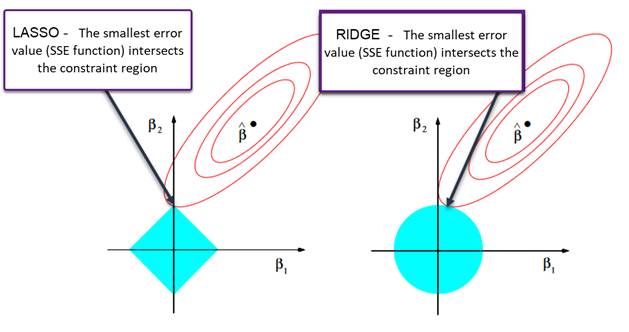
RegressionFigure coefficients,2 standard errors,-SSE and confidenceregression intervalsconstraints for(adjusted according to Hastie, Tibshirani & Friedman, 2009).
Figure 2 shows the indirectconstraint effectsregion (mediatorsdetermined EIby dimension:the SEA,Ridge ROE,and UOE)
| fact the Ridge | regression constraints
| no corners,
| with
|
|
|
|
|
|
|
|
|
|
|
|
|
|
|
|
|
|
|
|
|
|
Note. B = non-standardizedzero beta coefficients; *pare <less likely than at Lasso (according to Kampe, Brody, Friesenhahn, Garret and Hegy, 2017).05; **p < .01; CI 95% confidence interval: LCI/UCI lower/upper confidence interval.
DiscussionRIDGE regression is a form of L2 regularization. The goal is to create a new regression line that does not fit the training data too perfectly, thereby introducing a certain level of bias as the line adjusts to the data. By increasing this bias, we can reduce the total variance. Using Ridge regression, we create a regression line that initially adapts less to the data, which can lead to improved predictions, especially in the case of small sample sizes.
ThisThe studykey contributesaspect of this method is that we can have fewer respondents than variables, which is not the case with Ordinary Least Squares (OLS) regression. As the value of Lambda decreases, the slope of the regression line becomes steeper. When Lambda equals 0, the penalty for Ridge regression is zero, meaning the sum of squared residuals is minimally reduced; in this case, the regression line remains the same as the OLS line. As Lambda increases, the slope of the regression line decreases compared to anthe understandinginitial OLS line. In theory, a higher value of Lambda will result in a flatter regression line, and it is possible for the slope to reach 0.
The increasing slope of the lines suggests that the predictive model (Ordinary Least Squares, or OLS) is improving. However, a problem arises when making comparisons due to the growing influence of the x-axis values on the y-axis. When the regression line (OLS) is very steep, the estimated values for the y-axis become highly sensitive to even minor changes in the x-axis. To address this issue, cross-validation is employed to determine the optimal Lambda value that minimizes variance. RIDGE regression is used to divide the data into two groups: training data and testing data. OLS is applied to the training data to generate a regression line. This regression line can be analyzed in terms of bias and variance concerning the testing data. A model with a lower bias in the training data typically exhibits greater variance in the testing data. The goal is to improve the relationship between mindfulness,the dimensionsvariables but on the principle of emotionallinear intelligencedependence. This discrepancy between the actual association relationship and self-compassion.the regression (in this case OLS) is biased.
AsBy expected,introducing a new RIDGE regression line that minimizes the resultssum showedof squared errors, a RIDGE regression penalty (lambda +slope2) is applied. This penalty reduces the influence of predictor variables on the dependent variable, which is particularly useful for identifying variables that mindfulnesshave wasa positivelysmaller relatedimpact on the outcome. This approach helps control for these less significant variables. A common issue with ordinary least squares (OLS) regression is that adding more regressor variables can artificially inflate the coefficient of determination (R²), which represents the total variability of the dependent variable that can be explained by the predictor variables. In this case, it is about overfitting, i.e. too good agreement with existing data, but not so good when it comes to self-compassion,predicting new values using the regression equation. This is especially important when it comes to multiple predictor variables and when they correlate because then multicollinearity is controlled using penalty values (especially LASSO regression); individual correlated variables are thrown out (because the regression coefficients decrease to 0 values), i.e. only individual variables from correlated groups of variables are singled out (beta coefficients are higher). The biggest benefit of RIDGE regression (but also LASSO) is the influence (control) of multicollinearity that affects regression parameters (insight using VIF in OLS regression). Multicollinearity also affects the covariance matrix and can lead to an almost singular matrix. This is a problem because it can make the inverse matrix unstable. The solution lies in reducing the parameters, i.e. reduced eigenvalue, i.e. ensuring that the eigenvalues in the covariance matrix are always positive, i.e. suitable for inversion (X′X + X′X + λI; I = inverse matrix). Although both bivariatelyRIDGE and uniquely.LASSO These resultsregressions are part of linear models, they can also be used in linenon-parametric withnonlinear previousregressions research (Egan et al., 2021; Hollis-Walker & Colosimo, 2011; McArthur at al., 2017; Martinez-Rubio et al., 2023; Tran et al., 2022). Alsosuch as expected, results showed that overall EI was positivelyLogistic and moderatelyPolynomial.
For a small value of λ, the variance of the RIDGE regression dominates the MSE, which is to self-compassion,be expected since the estimated λ of the RIDGE regression is close to the unbiased ML (maximum likelihood) regression estimate. For a larger value of λ, the variance decreases and the bias dominates the MSE (increases). Analogously, for very small values of λ RIDGE regression, the increase in linevariance withexceeds previousthe studiesincrease in its own bias. (DiWessel Fabiovan &Wieringen, Saklofske,2023, 2021;Fig. Heffernan3a). etAnalogous al.,to 2011;Figure Neff,3b; 2003b;MSE[ Thomasˆβ(λ)] et< al.,MSE[ 2024).ˆβ(0)] for λ < 7 id est. by increasing lambda, the Ridge regression estimator outperforms its ML value.
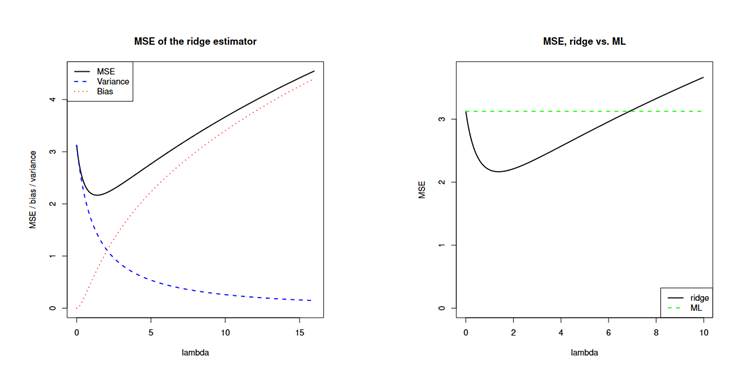
Figure 3a (left) - Relationship between MSE and bias, RIDGE regression variance
for different λ (after Weseel van Wieringen, 2023)
ThisFigure study3b also(right) revealed- MSE, RIDGE vs, ML
Regularization L1, L2
Regularization is a process that helps reduce overfitting and control the relationshipcoefficients betweenin specificstatistical EImodels. dimensionsWalker (2004) compares Ordinary Least Squares (OLS) and self-compassion.RIDGE Moreregression precisely,models resultsusing showednon-experimental data and highlights the superior accuracy of the RIDGE regression model (also Dempster, Schatzoff & Wermuth, 1977; Kennedy, 1988). When deciding which method to use, the authors note that threethe choice depends on the context and the objectives of fourthe EIresearch. dimensions,However, i.e.,regarding perceptionmulticollinearity—which can lead to decreased validity and understandingaccuracy of- emotionOLS inshould self,definitely usenot ofbe emotionused. forInstead, self-motivatingthe purposeRIDGE andregression self-regulation were bivariately and uniquely associated with self-compassion. These EI dimensions essentially represent ways in which a personmodel is able to be compassionate toward self. Neff (2003a) argued that in order to experience self-compassion a person should be able to monitor and clearly apprehend their own emotions, and use that information to rapidly recover from painful experiences by transforming them into self-kindness and self-understanding (Neff, 2003). Therefore, this study’s results extend similar prior research (Şenyuva et al., 2011) which found that self-management and self-motivation are positively related to self-compassion and further suggest the crucial role of these EI dimensions for experiencing self-compassion.recommended.
InL1 thisregularization, study,also known as Lasso regularization, is defined by the EIequation dimensionL₁ = λ (|β₁| + |β₂| + … + |βₚ|), where the penalty term is represented as ![]() . In L1 regularization, as opposed to L2 regularization, the focus is on the absolute values of
. In L1 regularization, as opposed to L2 regularization, the focus is on the absolute values of perceptionthe coefficients (β). This is because the parameters in the loss function can have negative values, which indicates a decrease in the function's value. The solution provided by L1 regularization involves adding the absolute values of the parameters (β). This process tends to reduce the beta coefficients more significantly, leading to more reliable predictions.
L2 regularization, also known as Ridge regression, is very similar to L1 regulation, but with one key difference: in L2 regularization, the parameters (beta) are not treated as absolute values. Instead, the penalty term is expressed as L2 = λ (β₁ + β₂ + … + βₚ). Another approach that combines both L1 and understandingL2 regularization is called Elastic Net. The efficiency of emotionthe cost function in othersboth L1 and L2 regulation depends on the value of lambda. When lambda equals 0, the results are identical to those obtained from Ordinary Least Squares (OLS) regression, which highlights the need for larger lambda values. The optimal lambda value is the one that minimizes the Mean Squared Error (MSE) on the validation dataset. MSE is calculated as MSE = SSE/n, where SSE is the sum of squared errors, or MSE =![]() which is analogous to the Loss or cost function. When working with cost functions, it is important to be cautious about their size. Introducing a penalty term can lead to an insignificant model by increasing the type 2 error. Cross-validation is one effective solution; it involves comparing subsets of data across multiple iterations (k iterations). The optimal lambda value is identified as the one that yields the smallest deviation between the testing and training data. If the coefficients derived from the training dataset yield accurate predictions for the test dataset, the lambda values can be kept low. However, if the coefficients result in poor predictions, the lambda values will need to be higher. Cross-validation helps to prevent overfitting across all datasets (according to Van del Velde, Piersoul, De Smet, and Rupper, 2021).
which is analogous to the Loss or cost function. When working with cost functions, it is important to be cautious about their size. Introducing a penalty term can lead to an insignificant model by increasing the type 2 error. Cross-validation is one effective solution; it involves comparing subsets of data across multiple iterations (k iterations). The optimal lambda value is identified as the one that yields the smallest deviation between the testing and training data. If the coefficients derived from the training dataset yield accurate predictions for the test dataset, the lambda values can be kept low. However, if the coefficients result in poor predictions, the lambda values will need to be higher. Cross-validation helps to prevent overfitting across all datasets (according to Van del Velde, Piersoul, De Smet, and Rupper, 2021).
Empirical part
The matrix of a non-experimental research design (n=156) was used in which the role of 3 predictors (father's education, non-violent behavior and type of school) on the general success of students was tested. Regression analysis determined the total variability of general school success, which can be explained by the role of predictors, R2=0.226, R2adjust=0.211.
ANOVA; F(14.777; 3) p<0.01 confirmed that at least one predictor variable is significantly related to the dependent variable. Multicollinearity was not relateddetermined (VIF=1.026 - 1.246). However, the model itself is suspect according to self-compassion.OLS Thisdue could be becauseto the appliedlow Wongregression coefficients (β1unstandardized = 0.094, β2unstandardized = - 0.320, β3unstandardized = - 0.358). In order to additionally control overfitting and Lawthe (2002)reliability OEA scale measures being perceptive and apprehending others’ emotions rather than using that information for influencing or managing others' emotions which is known to be usually positively related to self-compassion (e.g., Di Fabio & Saklofske, 2021). Also, this result is interesting from a developmental perspective since Maynard et al., (2022) study on an adolescent sample revealed a small but significant negative correlation (r = -.20**) betweenof the abilityregression tomodel, identifyL2 the emotional states of others and self-compassion. More specifically, their findings suggest that adolescents who demonstrate a heightened ability to perceive emotions in others, particularly negative emotions, experience lower levels of self-compassion and feelings of self-worth. Self-compassion varies depending on ageregularization (TaversRIDGE) etwas al., 2024), and it may be that the relationship between self-compassion and OEA and other EI dimensions may also be different depending on age, but this should be further investigated.used.
The otherprevalence mainof finding70% of the studytraining isdata thatwas determined; more precisely 71.2% and 28.8% of test data (Holdout). A fixed lambda (penalty term) was not determined, but λmax=20, λmin=0.5, and λinterval=1 were defined. Cross-validation λ=20 with 5 iterations was performed on the partiallytotal mediatingdata roleset. Each iteration was performed on both data sets; training and testing (validation) data to obtain separate regression parameters, and finally after all iterations of theall EI dimensions in the relationship between mindfulness and self-compassion. Results indicated that a higher levelgroups of mindfulness leads to a higher perception of emotion in self, higher use of emotions for self-motivation and a higher level of regulation of emotion, which all lead to a higher level of self-compassion. Park and Dhandrasubsets (2017) found that the tendency of mindful individuals to be attentive, present-focused, and non-judgmental makes them more capable of understanding and managing emotions well and utilizing these emotions and knowledge to prevent self-critical thoughts. Self-compassion requires that one does not harshly criticize the self in times of difficulty (Neff, 2003a). Also, Bao et al. (2015) obtained that mindful people have a better ability to regulate their emotions and make use of their emotions to motivate themselves, which enables them to perceive less stress. In university students’ higher mindfulness and self-compassion were also related to less perceived stress (Martínez-Rubio et al., 2023). Thus, it seems that mindfulness via the mentioned EI dimensions ensures a more emotionally balanced mindset needed to experience self-compassion rather than over-identification with negative experiences.
The result of partial mediation suggests that there may be also other mechanisms through which mindfulness may increase student’s self-compassion. Also, they point to the direct beneficial effect of mindfulness on self-compassion. Neff (2003a) theorized mindfulnessfolds) as a necessarytotal precursoraverage estimate of regression parameters. Of course, the number of subset iterations is arbitrary and can vary to alarger self-compassionatevalues. responseIn sincethe mindfulnesscase enableswhere mentalthe distancing from ongoing difficulties so that feelings of self-kindness and self-understanding can arise. Mental distancing, i.e., decentering reflects a shift in perspective associated with decreased attachment to one’s thoughts and emotions (Biehler & Naragon-Gainey, 2022; Brown et al., 2015). Itcategory is furthersmall posed that through decentering mindfulness may exert positive psychological outcomes, both directly and indirectly by mobilizing other psychological mechanisms, such as cognitive flexibility, values clarification, self-regulation, and exposure (Brown et al., 2015).
In this study, we theoretically posited that dimensions of EI precede self-compassion. However,samples, it is alsobetter possibleto thatincrease atthe least somenumber of subset (folds) on which the dimensionsiterations ofwill EIbe haveperformed abecause bidirectionalin andthis circularway relationshipthe withbias self-compassion.is Forreduced example,(variance ais higher level of self-compassion may lead to higher self-regulation,increased) since self-compassionmore decreasesdata stressfrom (Pootsthe &training Cassidy,data 2020)set and self-regulation is better when a person is not under stress. Thus, it may wellwill be thatincluded. theAfter relationshipcross-validation between(5 self-regulationfolds) of emotion and self-compassion is circular.average:
- · R2 training data=0,282
- · Average test Subset R2=0,066
- · Holdout R2=0,260
LimitationsThe greater the discrepancy between the R2 training model and practicalthe implications
Some limitations of this study should be addressed. First,(test), the cross-sectionallower naturethe reliability of the studyregression doesmodel. not allow us to draw any conclusions aboutIn the directioncase when R2 training data > Holdout R2 (test model) most often indicates overfitting, i.e. weak generalization of causalitythe inmodel. The best option is approximately the associationssame observed.value Further,of longitudinalR2 studiestraining and test model (holdout). The potential discrepancy of the stated R2 values is affected by the number of data subsets (folds) on which the iterations are requiredperformed toand revealof course also the dynamiclambda reciprocalvalues. nature Since it is an iterative procedure, the values of R2 always depend on the iterative procedure of allcross-validation since the study variables. Second, this study focused on EI as a trait. Since EI may be conceptualized also as ability, future studies may focus on such conceptualizationselection of EI.k samples is carried out by randomization.
PerSo, practicalin implications,this sincecase, previousthere studiesis suggesteda thatsmall mindfulness,discrepancy EI,between andR2 self-compassiontraining data > Holdout R2 (test model), i.e. the model is relatively reliable, i.e. generalizations can be trainedmade. (NelisThe etvalues al., 2011; Smeets et al., 2014; Tang et al., 2019), educational institutions may include knowledge about these concepts and offer training to students in order to further increase their self-compassion.
Conclusions
This study showed that dimensions of EI, i.e., perception and understanding of emotion in self, use of emotion for self-motivating purpose and self-regulation, mediated the relationship between mindfulness and self-compassion, i.e., that higher mindfulness led to higher emotional intelligence, which in turn lead to higher self-compassion. These findings serve as the basis for directing greater attention of the educationalRIDGE processregression intocoefficients thefor developmenteach category of mindfulnesspredictor andvariables EI,are especially dimensions of perception and understanding of emotionshown in self,Table use of emotion for self-motivating purpose and self-regulation1., in order to promote students‘ self-compassion and, consequently, their readiness for the demands of the profession.
References
Baer, R. A., Smith, G. T., Hopkins, J., Krietemeyer, J., & Toney, L. (2006). Using self-report assessment methods to explore facets of mindfulness. Assessment, 13(1), 27–45. https://doi.org/10.1177/1073191105283504
Bao, X., Xue, S., & Kong, F. (2015). Dispositional mindfulness and perceived stress: The role of emotional intelligence. Personality and Individual Differences, 78, 48–52.
Biehler, K. M., & Naragon-Gainey, K. (2022). Clarifying the relationship between self-compassion and mindfulness: An ecological momentary assessment study. Mindfulness, 13(4), 843–854. https://doi.org/10.1007/s12671-022-01865-z
Brown, D. B., Bravo, A. J., Roos, C. R., & Pearson, M. R. (2015). Five facets of mindfulness and psychological health: Evaluating a psychological model of the mechanisms of mindfulness. Mindfulness, 6, 1021–1032. https://doi.org/10.1007/s12671-014-0349-4
Brown, K. W., & Ryan, R. M. (2003). The benefits of being present: Mindfulness and its role in psychological well-being. Journal of Personality and Social Psychology, 84(4), 822–848. https://doi.org/10.1037/0022-3514.84.4.822
Cheng, X., Ma, Y., Li, J., Cai, Y., Li, L., & Zhang, J. (2020). Mindfulness and psychological distress in kindergarten teachers: The mediating role of emotional intelligence. International Journal of Environmental Research and Public Health, 17(21), Article 8212. https://doi.org/10.3390/ijerph17218212
Di Fabio, A., & Saklofske, D. H. (2021). The relationship of compassion and self-compassion with personality and emotional intelligence. Personality and Individual Differences, 169, Article 110109. https://doi.org/10.1016/j.paid.2020.110109
Du Plessis, M. (2023). Trait emotional intelligence and flourishing: The mediating role of positive coping behaviour. SA Journal of Industrial Psychology, 49(0), Article a2063. https://doi.org/ 10.4102/sajip.v49i0.2063
Egan, H., O’Hara, M., Cook, A., & Mantzios, M. (2022). Mindfulness, self-compassion, resiliency and wellbeing in higher education: a recipe to increase academic performance. Journal of Further and Higher Education, 46(3), 301–311. https://doi.org/10.1080/0309877X.2021.1912306
Ewert, C., Vater, A., & Schröder-Abé, M. (2021). Self-compassion and coping: A meta-analysis. Mindfulness, 12, 1063–1077. https://doi.org/10.1007/s12671-020-01563-8
Fong, M., & Loi, N. M. (2016). The mediating role of self‐compassion in student psychological health. Australian Psychologist, 51(6), 431–441. https://doi.org/10.1111/ap.12185
Heffernan, M., Quinn Griffin, M. T., McNulty, S. R., & Fitzpatrick, J. J. (2010). Self-compassion and emotional intelligence in nurses. International Journal of Nursing Practice, 16(4), 366–373. https://doi.org/10.1111/j.1440-172x.2010.01853.x
Hollis-Walker, L., & Colosimo, K. (2011). Mindfulness, self-compassion, and happiness in non-meditators: A theoretical and empirical examination. Personality and Individual differences, 50(2), 222–227. https://doi.org/10.1016/j.paid.2010.09.033
Kalebić Jakupčević, K. (2014). Provjera uloge metakognitivnih vjerovanja, ruminacije, potiskivanja misli i usredotočenosti u objašnjenju depresivnosti [The role of metacognitive beliefs, rumination, thought suppression and mindfulness in depression]. (Doctoral disertation, Zagreb. Filozofski fakultet). Retrieved on 29th of March 2022 from https://www.bib.irb.hr/713854
Lopes, P. N., Brackett, M. A., Nezlek, J. B., Schütz, A., Sellin, I., & Salovey, P. (2004). Emotional intelligence and social interaction. Personality and Social Psychology Bulletin, 30, 1018–1034. https://doi.org/10.1177/0146167204264762
Martínez-Rubio, D., Colomer-Carbonell, A., Sanabria-Mazo, J. P., Pérez-Aranda, A., Navarrete, J., Martínez-Brotóns, C., Escamilla, C., Muro, A., Montero-Marin, J., Luciano, V. J., & Feliu-Soler, A. (2023). How mindfulness, self-compassion, and experiential avoidance are related to perceived stress in a sample of university students. Plos one, 18(2), Article e0280791. https://doi.org/10.1371/journal.pone.0280791
Martins, A., Ramalho, N., & Marin, E. (2010). A comprehensive meta-analysis of the relationship between emotional intelligence and health. Personality and Individual Differences, 49, 554–564. https://doi.org/10.1016/j.paid.2010.05.029
Mayer, J. D., Salovey, P., & Caruso, D. R. (2004). Emotional intelligence: Theory, findings, and implications. Psychological Inquiry, 15, 197–215. https://doi.org/10.1207/s15327965pli1503_02
Maynard, M. L., Quenneville, S., Hinves, K., Talwar, V., & Bosacki, S. L. (2022). Interconnections between emotion recognition, self-processes and psychological well-being in adolescents. Adolescents, 3(1), 41–59. https://doi.org/10.3390/adolescents3010003
McArthur, M., Mansfield, C., Matthew, S., Zaki, S., Brand, C., Andrews, J., & Hazel, S. (2017). Resilience in veterinary students and the predictive role of mindfulness and self-compassion. Journal of Veterinary Medical Education, 44(1), 106–115. https://doi.org/10.3138/jvme.0116-027R1
Neff, K. (2003a). Self-Compassion: An Alternative Conceptualization of a Healthy Attitude Toward Oneself. Self and Identity, 2(2), 85–101. https://doi.org/10.1080/15298860309032
Neff, K. D. (2003b). The development and validation of a scale to measure self-compassion. Self and Identity, 2(3), 223–250. https://doi.org/10.1080/15298860309027
Neff, K. D., Hsieh, Y. P., & Dejitterat, K. (2005). Self-compassion, achievement goals, and coping with academic failure. Self and identity, 4(3), 263–287. https://doi.org/10.1080/13576500444000317
Nelis, D., Kotsou, I., Quoidbach, J., Hansenne, M., Weytens, F., Dupuis, P., & Mikolajczak, M. (2011). Increasing emotional competence improves psychological and physical well-being, social relationships, and employability. Emotion, 11(2), 354–366. https://doi.org/10.1037/a0021554
Park, H. J., & Dhandra, T. K. (2017). The effect of trait emotional intelligenceon the relationship between dispositional mindfulness and self-esteem. Mindfulness, 8(5), 1206–1211. https://doi.org/10.1007/s12671-017-0693-2
Petrides, K. V., & Furnham, A. (2001). Trait emotional intelligence: Psychometric investigation with reference to established trait taxonomies. European Journal of Personality, 15, 425–448.
Poots, A., & Cassidy, T. (2020). Academic expectation, self-compassion, psychological capital, social support and student wellbeing. International Journal of Educational Research, 99, 101506. https://doi.org/10.1016/j.ijer.2019.101506
Pradhan, R. K., & Jandu, K. (2023). Evaluating the impact of conscientiousness on flourishing in Indian higher education context: Mediating role of emotional intelligence. Psychological Studies, 68(2), 223–235. https://doi.org/10.1007/s12646-022-00712-4
Raes, F., Pommier, E., Neff, K. D., & Van Gucht, D. (2010). Construction and factorial validation of a short form of the Self-Compassion Scale. Clinical Psychology & Psychotherapy, 18(3), 250–255. https://doi.org/10.1002/cpp.702
Rahe, M., Wolff, F., & Jansen, P. (2022). Relation of mindfulness, heartfulness and well-being in students during the coronavirus-pandemic. International journal of applied positive psychology, 7(3), 419–438. https://doi.org/10.1007/s41042-022-00075-1
Schutte, N. S., & Loi, N. M. (2014). Connections between emotional intelligence and workplace flourishing. Personality and Individual Differences, 66, 134–139. http://dx.doi.org/10.1016/j.paid.2014.03.031
Schutte, N. S., & Malouff, J. M. (2011). Emotional intelligence mediates the relationship between mindfulness and subjective well-being. Personality and individual differences, 50(7), 1116–1119. http://dx.doi.org/10.1016/j.paid.2011.01.037
Şenyuva, E., Kaya, H., Işik, B., & Bodur, G. (2014). Relationship between self‐compassion and emotional intelligence in nursing students. International journal of nursing practice, 20(6), 588–596. https://doi.org/10.1111/ijn.12204
Smeets, E., Neff, K., Alberts, H., & Peters, M. (2014). Meeting suffering with kindness: Effects of a brief self-compassion intervention for female college students. Journal of Clinical Psychology, 70(9), 794–807. doi:10.1002/jclp.22076
Tang, Y-Y., Tang, R., & Gross, J. J. (2019). Promoting psychological well-being through an evidence-based mindfulness training program. Frontiers in Human Neuroscience, 13, Article 237. https://doi.org/10.3389/fnhum.2019.00237
Tavares, L., Xavier, A., Vagos, P., Castilho, P., Cunha, M., & Pinto-Gouveia, J. (2024). Lifespan perspective on self-compassion: Insights from age-groups and gender comparisons. Applied Developmental Science, 1–17. https://doi.org/10.1080/10888691.2024.2432864
Thomas, C. L., Allen, K., & Sung, W. (2024). Emotional Intelligence and Academic Buoyancy in University Students: The Mediating Influence of Self-Compassion and Achievement Goals. Trends in Psychology, 1–27. https://doi.org/10.1007/s43076-024-00363-6
Tran, M. A. Q., Vo-Thanh, T., Soliman, M., Khoury, B., & Chau, N. N. T. (2022). Self-compassion, mindfulness, stress, and self-esteem among Vietnamese university students: Psychological well-being and positive emotion as mediators. Mindfulness, 13(10), 2574–2586. https://doi.org/10.1007/s12671-022-01980-x
Wong, C. S., & Law, K. S. (2002). The effects of leader and follower emotional intelligence on performance and attitude: An exploratory study. Leadership Quarterly, 13(3), 243–274. http://dx.doi.org/10.1016/s1048-9843(02)00099-1
Zewude, G. T., Gosim, D., Dawed, S., Nega, T., Tessema, G. W., & Eshetu, A. A. (2024). Investigating the mediating role of emotional intelligence in the relationship between internet addiction and mental health among university students. PLOS Digital Health, 3(11), Article e0000639. https://doi.org/10.1371/journal.pdig.0000639
|
|
| |||||
| ||||||
| |||||
| Regression |||||
|
|||||
|
|
Standardizing Valuesc |
Standardized Coefficients |
Unstandardized Coefficients |
||
|
Mean |
Std. Dev. |
||||
|
20,000 |
Interceptb |
. |
. |
3,892 |
3,846 |
|
[V4=1] |
,351 |
,477 |
,098 |
,205 |
|
|
[V4=2] |
,297 |
,457 |
,064 |
,139 |
|
|
[V4=3] |
,153 |
,360 |
-,042 |
-,118 |
|
|
[V4=4] |
,072 |
,259 |
,017 |
,066 |
|
|
[V4=5] |
,126 |
,332 |
-,195 |
-,589 |
|
|
|
,018 |
,133 |
-,038 |
-,286 |
|
|
Father's education =2] |
,117 |
,322 |
-,096 |
-,298 |
|
|
Father's education =3] |
,126 |
,332 |
-,015 |
-,046 |
|
|
Father's education =4] |
,387 |
,487 |
,041 |
,085 |
|
|
Father's education =5] |
,072 |
,259 |
-,053 |
-,206 |
|
|
Father's education =6] |
,135 |
,342 |
,102 |
,299 |
|
|
Father's education =7] |
,018 |
,133 |
,034 |
,254 |
|
|
Father's education =8] |
,027 |
,162 |
,023 |
,141 |
|
|
Father's education =9] |
,099 |
,299 |
-,028 |
-,094 |
|
|
[school=1] |
,523 |
,499 |
,091 |
,182 |
|
|
[school=2] |
,477 |
,499 |
-,091 |
-,182 |
|
|
a. Dependent Variable: school success |
|||||
|
b. The intercept is not penalized during estimation. |
|||||
|
c. Values used to standardize predictors for estimation. The dependent variable is not standardized. |
|||||
Categories of predictor variables: Father's education (1- incomplete primary school, 2- primary school, 3- three-year high school, 4- four-year high school, 5- bachelor's degree, 6- completed graduate studies, 7- postgraduate studies, 8- doctorate, 9 -not specified), School (1-urban, 2 -suburban), V4- I resolve conflicts through negotiations and compromises (1-completely so, 2-mostly true, 3-can't decide, 4-mostly not true, 5- not at all).
The predictors have been standardized (MEAN = 0, SD = 1) to ensure that the penalty term impacts all coefficients equally. The regression coefficients table presents both standardized and unstandardized betas for each category of the predictors, illustrating their relationship with the dependent variable.
As shown in Table 1, after introducing the penalty term in the RIDGE regression, category 5 of the predictor variable (V4), which corresponds to "I do not resolve conflicts at all through negotiations and compromises," contributes the most to the variability of the dependent variable (school success). Specifically, since the standardized beta (βstd) is negative, this indicates that an increase of 1 standard deviation in this predictor category results in a decrease of -0.195 standard deviations in the dependent variable (school success). This suggests that individuals who do not resolve conflicts through negotiation and compromise are likely to perform worse academically, based on the direction of the scale. When the model is effective, the regression coefficients for the predictor categories tend to be reduced upon introducing the penalty term, leading to coefficients that are more reliable and accurate. In this instance, there was a slight decrease in the regression coefficients of the predictor variables following the application of L2 regularization (RIDGE regression), as illustrated in Table 2.
|
Table 2 - Model Comparisonsa,b,c |
|
||
|
Alpha/ Lambda |
Average Test Subset R Square |
Average Test Subset MSE |
|
|
20,000 |
,066 |
,555 |
|
|
19,500 |
,066 |
,555 |
|
|
18,500 |
,065 |
,556 |
|
|
17,500 |
,063 |
,557 |
|
|
16,500 |
,062 |
,557 |
|
|
15,500 |
,061 |
,558 |
|
|
14,500 |
,059 |
,559 |
|
|
13,500 |
,058 |
,560 |
|
|
12,500 |
,056 |
,561 |
|
|
11,500 |
,055 |
,562 |
|
|
10,500 |
,053 |
,563 |
|
|
9,500 |
,051 |
,564 |
|
|
8,500 |
,049 |
,565 |
|
|
7,500 |
,047 |
,566 |
|
|
6,500 |
,045 |
,568 |
|
|
5,500 |
,043 |
,569 |
|
|
4,500 |
,041 |
,570 |
|
|
3,500 |
,038 |
,572 |
|
|
2,500 |
,036 |
,573 |
|
|
1,500 |
,033 |
,575 |
|
|
,500 |
,030 |
,577 |
|
|
a. Dependent Variable: school success |
|
||
|
b. Model: V4, Father´s education, school c. Number of cross-validation folds: 5
|
|
||
Table 2 shows a comparison of the models on the strength of the penalty term, i.e. lambda, MSE (mean square error) of the difference between the data subsets, and in the cross-validation process (MSE is the average of the squared difference between the predicted and actual values). It can be seen that there was an increase in R squared (coefficient of determination) with increasing lambda (penalty term), i.e. the total percentage of the variance of the dependent variable explained by the predictor variables between the subsets. The higher the R2, the better the regression model, i.e. the better it fits the data (conditionally). In this case, the contribution of the penalty term to iterations with even 20 lambda values is not large, since with increasing lambda there is also no large increase in R2 between the subsets. However, the average MSE of the test subset decreased in comparison, i.e. the difference between the observed and predictive values (on the regression line) decreased.
Figure 4 shows a scatterplot of the predicted value residuals for the training and testing data.
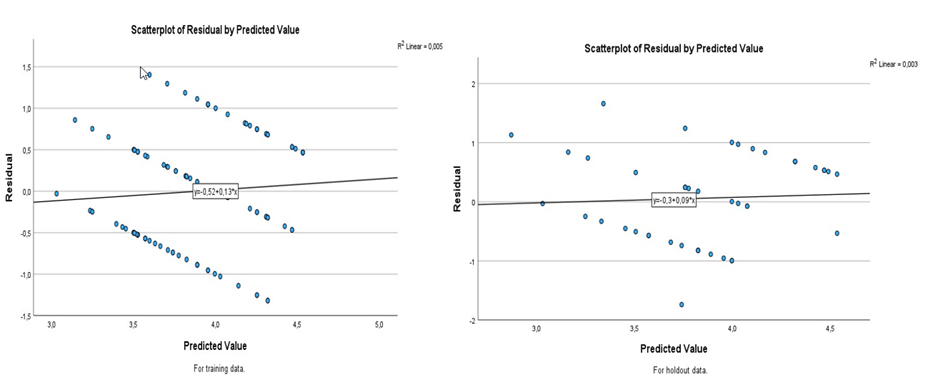
Figure 4 - Scatterplot of residuals by predicted value for training and testing data.
As can be seen in Figure 4, there was a decrease in the slope of the regression line and the definition of the regression equation (holdout data). Analogously, average cross-validation is shown in Figure 5; MSE vs alpha (or λ) and R2 vs alpha (or λ).
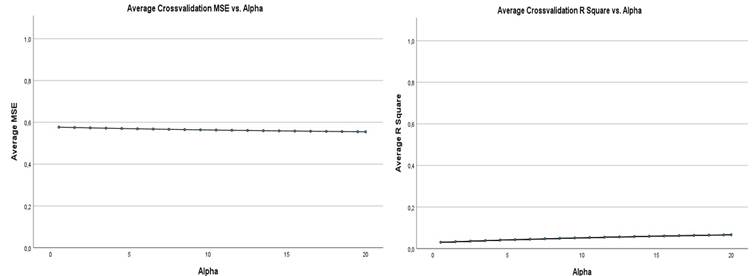
Figure 5 - cross-validation; MSE vs alpha (or λ) te R2 vs alpha (or λ).
In parallel, L1 regularization (LASSO), cross-validation was performed on the same data; λmax=20, λmin=0.5, λinterval=1. Cross-validation λ=1-20 with 5 iterations was performed on the total data set. The results indicate that the values of all lambdas 1-20 for all categories of predictor variables, beta coefficients are zero (βstd=0; β=0); ![]() β=0 which indicates the impossibility of interpreting the regression model (which is often the case with LASSO regression). In comparison with L1 regulation average MSE =0.60587 (λ1-λ20), and Average R2 is unchanged (λ1-λ20).
β=0 which indicates the impossibility of interpreting the regression model (which is often the case with LASSO regression). In comparison with L1 regulation average MSE =0.60587 (λ1-λ20), and Average R2 is unchanged (λ1-λ20).
The initial linear regression analysis was conducted using three predictor variables with ordinary least squares (OLS). After applying L2 regularization (Ridge regression) with cross-validation (λmax = 20, λmin = 0.5, λinterval = 1.0, using 5 folds, iterations), there was a notable reduction in the beta coefficients across the categories. This adjustment resulted in a decrease in mean squared error (MSE) and an increase in the R-squared (R²) value as the regularization parameter λ increased.
Initially, the OLS regression model was examined using a Bayesian approach, which favored the alternative hypothesis with a Bayes Factor of BF(10) = 17.938. The R² value was found to be 0.303, with an adjusted R² of 0.239. In contrast, the application of L1 regularization (LASSO) rendered the model uninterpretable due to insignificance, suggesting a type II error.
Conclusion
LASSO and RIDGE linear regressions offer improvements over ordinary least squares (OLS) regression, particularly in controlling overfitting and providing more reliable and accurate regression parameters. Their use is especially beneficial in situations with significant multicollinearity. One key difference between the two methods is that LASSO regression often reduces beta coefficients to nearly zero. While this can increase the risk of Type II errors, it can also result in better values for the coefficient of determination (R²).
Geraldo-Campos, Soria, and Pando-Ezcurra (2022) conducted a study comparing the predictive capabilities of four predictors on credit risk using a sample of 501298 companies in Peru. They found that LASSO regression (λ60 = 0.00038; RMSE = 0.357368) outperformed RIDGE regression in terms of predictive power. Wanishsakpong, Notodiputro, and Anwar (2024) examined the predictive roles of LASSO and RIDGE regressions in their analysis of daily temperatures in Taiwan. Their results showed that RIDGE regression successfully reduced the number of predictors from 32 to 13 and achieved better outcomes than LASSO regression in terms of MSE and R2 values. Ren (2024) investigated the Student Performance Data Set and compared the predictive performance of LASSO, RIDGE, and ELASTIC NET regressions. The findings indicated that LASSO regression provided the best predictions for grades based on this dataset, while RIDGE regression performed the worst.
Overall, both L1 (LASSO) and L2 (RIDGE) regularizations effectively address issues of overfitting and multicollinearity, leading to more accurate and reliable regression parameters.
It is important to consider that both LASSO and RIDGE regression are iterative procedures, and their outcomes depend on several factors: the number of k-fold cross-validation, the number of k-iterations, the distribution of training and testing data, and the value of lambda (though this is a minor concern). As noted by Irandoukht (2021), both LASSO and RIDGE regression are subjective techniques, so caution should be exercised in their application and interpretation.
The findings of this study emphasize the need for caution when using LASSO regression in particular, as the model may become uninterpretable (resulting in beta zero coefficients), while results from Ordinary Least Squares (OLS) regression, RIDGE regression, and Bayesian inference (BS) suggest otherwise.
CONFLICTS OF INTEREST
There is no conflict of interest related to any aspect of this work.
ACKNOWLEDGMENTS
I would like to thank my colleague Irena for the matrix used for the empirical part and the reviewer's valuable suggestions. I am grateful to Fisher Library The University of Sydney for the space to work.
Literature
Dempster, A. P., Schatzoff, M., & Wermuth, N. (1977). A simulation study of alternatives to ordinary least squares. Journal of the American Statistical Association, 72, 77-91.
Geraldo-Campos, L., Soria, Alberto J., Pando-Ezcurra, T. (2022). Machine Learning for Credit Risk in the Reactive Peru Program: A Comparison of the Lasso and Ridge Regression Models. Economies, 10, 188. https://doi.org/10.3390/economies10080188
Hastie, T., Tibshirani, R., Friedman, J. (2009). The Elements of Statistical Learning Data Mining, Inference, and Prediction- second edition. Springer. http://dx.doi.org/10.1007/978-0-387-84858-7
Hoerl, Arthur E & . Kennard, Robert W. (1975). Ridge regression iterative estimation of the biasing parameter. Communications in Statistics - Theory and Methods, 5, 77-88.
Kennedy, E. (1988). Biased estimators in explanatory research: An empirical investigation of mean error properties of ridge regression. Journal of Experimental Education, 56, 135-141.
Irandoukht, A. (2021). Optimum Ridge Regression Parameter Using R-Squared of
Prediction as a Criterion for Regression Analysis. Journal of Statistical Theory and
Applications, 20(2), 242–250.
Kampe, J., Brody, M., Friesenhahn, S., Garrett, A., Hegy, M. (2017). Lasso with Centralized Kernel. Final report - https://vadim.sdsu.edu/reu/2018-3.pdf Marquardt,
Marquardt, D. W., & Snee, R. D. (1975). Ridge Regression in Practice. The American Statistician, 29, 3-20.https://doi.org/10.1080/00031305.1975.10479105
Nelson, M., Biu, O. E., & Onu, O. H. (2024). Multi-Ridge, and Inverse- Ridge Regressions for Data with or Without Multi-Collinearity for Certain Shrinkage Factors. International Journal of Applied Science and Mathematical Theory, 10(2), 29-41.
Ren, P. (2024). Comparison and analysis of the accuracy of Lasso regression, Ridge regression and Elastic Net regression models in predicting students' teaching quality achievement. Applied and Computational Engineering, 51(1),313-319
DOI: 10.54254/2755-2721/51/20241625
Tibshirani, R. (1996). Regression Shrinkage and Selection via the Lasso. Journal of the Royal Statistical Society. Series B (Methodological), 58(1), 267-288.
Van del Velde, F., Piersoul, J., De Smet, I., Rupper, E. (2021). Changing Preferences in Cultural References. In; Kristiansen, G., Franco, K., De Pascale, S.(Eds). Cognitive Sociolinguistics Revisited (584-595). Berlin/Boston; Walter de Gruyter.
Walker, David A. (2004). Ridge Regression as an Alternative to Ordinary Least Squares: Improving Prediction Accuracy and the Interpretation of Beta Weights. AIR Professional File, Number 92.
Wanishsakpong, A., Notodiputro, K. Anwar (2024). Comparing the performance of Ridge Regression and Lasso techniques for modeling daily maximum temperatures in the Utraradit Province of Thailand. Modeling Earth Systems and Environment,10, 5703–5716. https://doi.org/10.1007/s40808-024-02087-z
Wessel, N. van Wieringen (2023). Lecture notes on ridge regression. This document is distributed under the Creative Commons Attribution-Non Commercial-ShareAlike license: http://creativecommons.org/licenses/by-nc-sa/4.0/ (accessed 4.11.2024)