
Correlation between Morphological Characteristics and Physical Activity of Female Students at the Faculty of Teacher Education
Ivana Nikolić1, Snježana Mraković1, Marko Kranjčević21 University of Zagreb, Faculty of Teacher Education 2 Primary School Grigor Vitez, Sveti Ivan Žabno |
|
Kinesiological paradigm in education |
Number of the paper: 57 |
Original scientific paper |
Abstract |
|
This research aimed to determine whether there is a correlation between the morphological components of fitness and the level of physical activity of female students enrolled at the Faculty of Teacher Education – Department in Čakovec. The sample consisted of 146 first-year full-time and part-time female students. The sample of variables was composed of eight anthropometric measures and the Baecke questionnaire on habitual physical activity. Spearman’s correlation coefficients between physical activity and anthropometric measures were calculated (body mass index, upper arm skinfold, suprailiac skinfold, thigh skinfold, percentage of body fat, abdominal circumference, and obesity risk index). The results showed that a large percentage of female students have a normal body mass of 75.9%, but the percentage of 24.1% of increased body weight and obesity is of concern. The results also showed that 91.7% of students have a normal obesity index, while only 8.3% have an increased index. With the descriptive parameters of the Baecke questionnaire, the highest average value was achieved in the domain of leisure time, smaller in sports. In contrast, the lowest average value of physical activity was achieved in the domain of faculty. Spearman’s correlation coefficients between morphological variables and physical activity indicate low negative values in all morphological variables, except in the abdominal range. The variable leisure time index showed a significant negative correlation only with the thigh skinfold. A poor negative correlation was obtained between total physical activity and body mass index, upper arm skinfold, thigh skinfold, percentage of body fat, and hip size. |
|
Key words |
|
Baecke questionnaire; morphological components; physical activity |
Introduction
Nowadays, we are witnessing an increase in overweight in children and adults. According to the World Health Organization (WHO, 2021), in 2016, 39% (39% of men and 40% of women) were overweight, and 13% (11% of men and 15% of women) were obese. In the Republic of Croatia, in 2019, 65% were overweight or obese (42% overweight and 23% obese) (HZJZ, 2021). Several studies underscore that a high percentage of body fat (%BF) is an independent factor in cardiovascular risk and coronary heart disease (Lee, 2016; Calling, Hedbland, Engstrom, Berglund, and Janzon, 2006). Physical activity (PA) has been shown to reduce the risk of many chronic non-communicable diseases associated with high body fat (Buchowski, Townsend, Chen, Acra, and Sun, 1997). However, worldwide, in 2016, about 28% of adults aged 18 and older did not meet the minimum level of 150 minutes per week of aerobic physical activity (WHO, 2021). A longitudinal study conducted by Yang, Telama, Viikari, and Raitakari (2006) indicated that maintaining a high level of physical activity from a young age to adulthood is associated with a lower risk of abdominal obesity in women but not in men. Based on a large sample of adult participants, Mišigoj Duraković et al. (2001) concluded that active versus inactive women show significantly better morphological characteristics and functional and motor abilities; more precisely, active women have a smaller waist circumference and a lower obesity risk index (waist-to-hip ratio, WHR). A study conducted in nine European countries to determine the correlation between PA and body mass index (BMI) and waist circumference cited negative correlations (Besson et al., 2009). Observational research showed a negative correlation between PA and BMI (Orsini, Bellocco, Bottai, Pagano, and Wolk, 2007). Likewise, higher PA is correlated with a lower BMI, lower waist circumference, and lower body fat percentage (Du et al., 2013). Studies carried out on adults mostly indicated negative correlations. In contrast, others, in which the average age was 21 years, reported no significant correlations due to a higher proportion of lean body mass in young adulthood (Bowen et al., 2015; Correa-Rodriguez, Rueda-Medina, Gonzales-Jimenez, and Schmidt-RioValle, 2017). The student population belongs to the transitional period between adolescence and adulthood, a period during which the PA level decreases significantly (Stephens et al., 1985). Continuous education of students about healthy habits and raising the awareness of PA significance can reduce the occurrence of various diseases and improve the quality of life.
This research aims to determine whether there is a correlation between the morphological components of fitness and the usual physical activity of female students.
Methods
Female students (N = 146) enrolled at the Faculty of Teacher Education in Čakovec participated in the research. The participants were first-year students of Teacher Education and Early and Preschool Care and Education programs, with an average age of 20 ± 0,60 years. Participation in the research was voluntary, and testing was conducted in March 2021 as part of regular Physical Education classes. The sample does not include those female students who were exempted from classes on the basis of medical certificates and female students who attended online classes due to epidemiological reasons caused by the COVID-19 pandemic. For the purposes of this research, eight anthropometric variables were measured: body height, body mass, body mass index, triceps skinfold, thigh skinfold, suprailiac skinfold, abdominal circumference, and hip circumference. Body mass index was calculated as the ratio of body mass (kg) to square body height (m), and the nutritional status was categorized as malnutrition (<18.50), normal nutritional status (18.50-24.99), and overweight 25–29.99), obesity of the first (30-34.99), second (35-39.99) and third-degree (≥40). The obesity risk index was calculated from the ratio of abdominal to hip circumference (WHO, 2008). The percentage of body mass was calculated by summing the upper arm, thigh, and suprailiac skinfolds, measured with a Lange caliper. Body density was determined with an equation (Jacskon and Pollock, 1985) and body fat percentage with the Siri formula (1956). The participants’ usual physical activity was determined with a multi-topic Baecke questionnaire (Baecke, Burema, and Frijters, 1982). Basic descriptive parameters were calculated for all variables, and the normality of the distribution was tested with the Kolmogorov-Smirnov test. Spearman’s correlation coefficients were calculated to determine the correlation. All data were processed in IBM SPSS Statistics 19.
Results
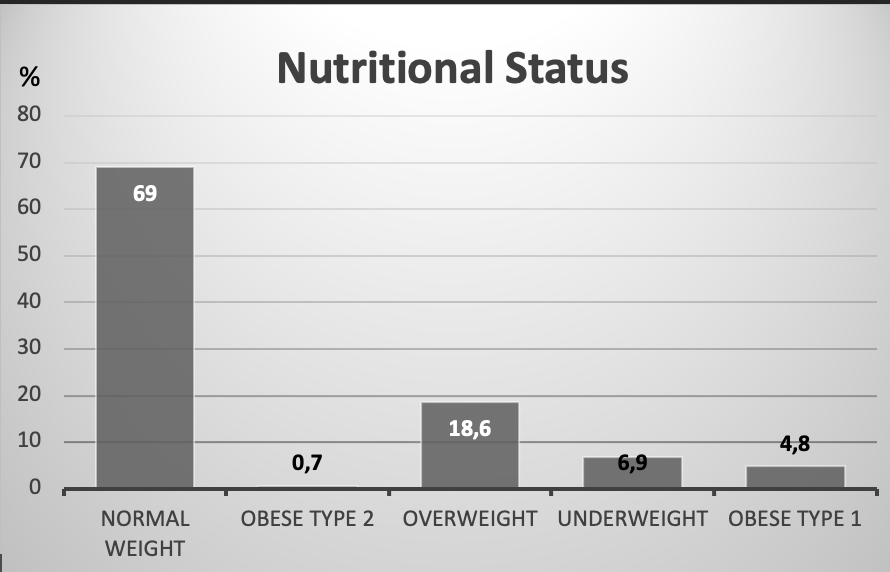
Figure 1 shows that the highest percentage of female students have a normal body mass (69%), increased body mass (18%), and 7% are malnourished, while class 1 obesity is recorded in 5% of female students. One female student in the total sample has type 2 obesity.
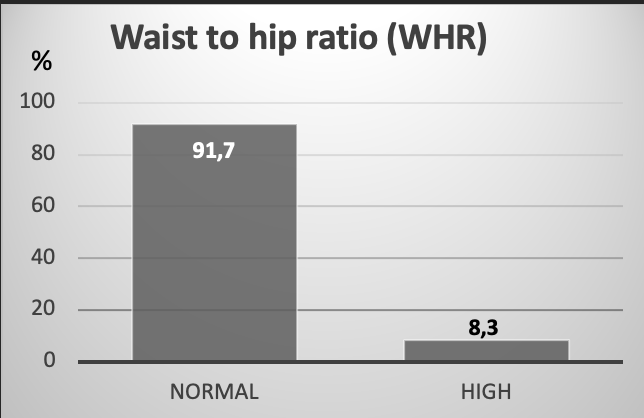
Figure 2. The proportion of participants for obesity risk assessment
Figure 2 shows the distribution of participants according to the obesity risk index. The risk of developing diseases associated with obesity increases with the obesity risk index value above 0.8 for women (Bray and Gray, 1988). Of the total sample, 91.7% of female students have a normal index, and 8.3% have an increased risk index above 0.8.
Table 1. Descriptive parameters of morphological variables and the Baecke questionnaire
|
Variables |
Min |
Max |
AS |
SD |
Skew |
Kurt |
KS-Z |
|
Body height |
155 |
196 |
167.00 |
6.29 |
1.03 |
2.55 |
.00 |
|
Body mass |
47.00 |
102.00 |
63.83 |
10.98 |
1.12 |
1.24 |
.00 |
|
Upper arm skinfold |
6.00 |
40.00 |
21.62 |
6.98 |
0.62 |
0.08 |
.00 |
|
Thigh skinfold |
12.00 |
50.05 |
32.22 |
7.45 |
-0.49 |
-0.62 |
.00 |
|
Suprailiac skinfold |
4.00 |
60.00 |
16.53 |
9.13 |
1.22 |
2.57 |
.00 |
|
Abdominal circumference |
60.00 |
111.00 |
76.20 |
9.74 |
1.08 |
1.41 |
.00 |
|
Hip circumference |
55.00 |
129.50 |
99.59 |
10.52 |
-0.46 |
3.43 |
.00 |
|
Body mass index (BMI) |
14.60 |
35.29 |
22.91 |
3.70 |
0.92 |
1.00 |
.00 |
|
Obesity risk index (WHR) |
0.65 |
1.35 |
0.77 |
0.08 |
3.89 |
23.02 |
.00 |
|
Body fat percentage (BF%) |
11.30 |
41.12 |
26.43 |
6.12 |
-0.01 |
-0.54 |
.20 |
|
Faculty index |
1.88 |
3.38 |
2.57 |
0.26 |
0.25 |
1.09 |
.00 |
|
Sports index |
1.50 |
4.25 |
2.63 |
0.62 |
0.41 |
-0.04 |
.00 |
|
Leisure time index |
1.75 |
5.00 |
3.26 |
0.61 |
0.31 |
-0.25 |
.00 |
|
Total physical activity |
6.00 |
11.25 |
8.47 |
1.03 |
0.17 |
-0.13 |
.09 |
Table 1 shows the average values of morphological variables and the Baecke questionnaire. According to the values of the minimum and maximum results, large ranges in the variables of body mass, skinfolds, and abdominal and hip circumferences can be observed. The values of asymmetry coefficients in thigh skinfold and hip circumference variables indicate the grouping of results in the area of higher values. The highest average values were achieved in leisure time (3.26) and sports (2.63), and the lowest in faculty (2.57). The results of the Kolmogorov-Smirnov test show a statistically significant deviation from the normal distribution in all morphological variables, except in the percentage of body fat and total physical activity that have a normal distribution.
Table 2. Spearman’s correlation coefficients between morphological variables and physical activity
|
Variables |
BMI |
UAS |
SS |
TS |
%BF |
AC |
HC |
WHR |
|
Faculty index |
-.04 |
.04 |
.00 |
.17 |
.06 |
-.03 |
.01 |
-.11 |
|
Sports index |
-.21 |
-.20 |
-.18 |
-.26 |
-.22 |
-.09 |
-.22 |
.10 |
|
Leisure time index |
-.12 |
-.11 |
-.10 |
-.19 |
-.15 |
-.02 |
-.13 |
.06 |
|
Total PA |
-.18 |
-.17 |
-.15 |
-.21 |
-.19 |
-.05 |
-.19 |
.08 |
Note. BMI = body mass index; UAS = upper arm skinfold; SS = suprailiac skinfold; TS = thigh skinfold; %BF =percentage of body fat; AC = abdominal circumference; HC = hip circumference; WHR = obesity risk index
Table 2 shows the correlation coefficients between morphological measures and different PA domains. Significant correlations between the sports index and all morphological variables, except for abdominal circumference and WHR, indicate low negative correlations (r = -.18; r = -.26). The variable leisure time index shows a significant negative correlation only with the thigh skinfold (r = -.19). A weak negative correlation was obtained between the total PA and body mass index (r = -.18), upper arm skinfold (r = -.17), thigh skinfold (r = -.21), body fat percentage (r = -.19), and hip circumference (r = -.19).
Discussion
The results indicate that 24% of female students are overweight and obese, which is similar to the 27% found in a survey conducted on a sample of adults aged 18 to 24 in Croatia, in 2019, as part of the European Health Interview Survey (EHIS) (HZJZ), 2021). An increased WHR was found in 8.3% of participants, while 91.7% had a normal obesity risk index. Compared to the average values of morphological variables (Mraković, 2011) obtained on a sample of female students of the same age at the Faculty of Medicine (FM), Faculty of Kinesiology (FK), and Faculty of Teacher Education (TE), female students in this research have a higher percentage of body fat (26.43%) compared to TE (21.79%), FM (24.16%), and FK (18.26%) female students. The measure of abdominal circumference also shows higher average values (76.20) compared to peers from other faculties (TE=70.66; FM=71.48; FK=69.55), including the measure of the hip circumference (99.59) compared to earlier results (TE=98.57; FK=97.09; FM=92.30). Participants from the Faculty of Kinesiology have the lowest values of skinfolds, which leads to the conclusion that they have a significantly greater muscle mass and less subcutaneous adipose tissue (Medved et al., 1992). Also, Kinesiology participants have higher average values in all PA indices (Mraković, 2011). Comparing the results with the research conducted by Heimer et al. (2004) on a large sample of male and female participants aged 20 to 65, approximately similar work/faculty indices were observed (2.52; 2.57), while the sports index, including the leisure time index (3.26; 2.89), of the participants in this research (2.63) was slightly higher in relation to adult participants (2.21). Research results obtained by Prendl (2014) on a sample of 143 male and female participants ranging in age from 20 to 64 years indicate an overall PA index of 8.16, while in this research, the index is 8.47. Compared to a survey conducted on a sample of 867 students from four Lithuanian universities (Miežienė, Šiupšinskas, and Jankauskiene, 2018) ranging from 18 to 22 years, the results indicate a higher sports index among Lithuanian male students (2.99) compared to the results of this research (2.63) and are approximately equal to the leisure time indices and higher average values of the faculty index of the participants in this research (2.62; 2.02).
In terms of correlations between morphological variables and PA, the obtained results are consistent with a study on a sample of female students (You, Tan, and Mat Ludin, 2020) in which a weak negative correlation (r = -.225) was found between PA and body fat percentage. Also, research on a sample of adolescent girls (Lohman et al., 2008) shows a low negative correlation between PA and the body mass index (r = -.14) and PA and the body fat percentage (r = -.12). Furthermore, there are significant negative correlations between the sports index and all skinfolds and body fat percentage. Since the sports index includes items related to the participants’ sports frequency and intensity, we assume that a higher value in the index includes more frequent activities of moderate and/or moderate to high intensity, so negative correlations indicate that those with higher body fat and subcutaneous fat tissues in the abdomen, upper arm, and thigh are less likely to participate in moderate and/or moderate to high-intensity activities, and vice versa. The results of this research are consistent with the results obtained from a sample of American students (Zanovec, Lakkakula, Johnson, and Turri, 2009) who show a negative association between PA and the body mass percentage. Moderate-intensity PA negatively correlates with body mass percentage in a sample of Lebanese students (Harmouche-Karaki et al., 2020). Also, Bradbury, Guo, Cairns, Armstrong, and Key (2017) stated a negative association between PA and the body mass index and body fat percentage in a sample of adult participants aged 40-69 years. In other words, more active participants had a lower percentage of body mass, despite equal values of body mass index. Yurdakul and Baydemir (2020) reported a negative correlation between PA levels and the triceps, thigh, and suprailiac skinfolds in a sample of 12-year-olds.
Insight into the descriptive parameters of circumference measures shows the grouping of participants in the area of lower values in the waist circumference and higher in the hip circumference. The negative correlation between the hip circumference and sports index indicates that those female participants who lean towards the gynoid type have a lower index in the domain of sports and total PA, while measures of waist circumference and WHR did not show a significant correlation with domains of PA. According to Cameron et al. (2012), waist and hip circumference measure different aspects of body composition and fat distribution and often have independent and opposite effects on cardiovascular disease risk factors. Thus, a narrower waist and wider hips can protect against cardiovascular disease. The individual effects of each circumference measure are poorly visible in the waist-to-hip ratio, which defines obesity with respect to subcutaneous fat distribution (Seidell, Perusse, Despres, and Bouchard, 2001). Thigh skinfold also shows the grouping of the participants in the area of higher values and a negative association with all PA domains. The results are consistent with research showing a negative correlation between thigh skinfold and endurance tests in women (Doymaz and Cavlak, 2007). Eliakim, Burke, and Cooper (1997) state that body fat distribution in adolescent girls depends on many factors, such as body weight and PA levels.
A positive correlation between thigh thickness and the faculty index is difficult to interpret meaningfully. However, one can assume that participants with higher subcutaneous adipose tissue in the thigh area subjectively overestimated their physical activity at the faculty.
We hypothesize that organized forms of physical exercise with the female student population would contribute to the regulation and reduction of body mass and subcutaneous adipose tissue, as shown by the research carried out by O’Connor and Lamb (2003) that studied the effects of resistance training on the thickness of skinfolds and muscle strength in women. The results showed a significant reduction in the sum of skinfolds and increased muscle strength.
This research has its limitations because PA was tested with the indirect method of self-assessment, so it is possible that the participants overestimated or underestimated their physical activity. Further research should examine the factors that limit regular PA. Since the research was conducted during the COVID-19 pandemic, the results can also be attributed to the limited mobility imposed to prevent and reduce the risk of virus transmission.
Conclusions
This research aimed to determine whether there is a correlation between the morphological components of fitness and the usual physical activity of female students. It was found that 24% of participants have increased body mass and obesity, and 3.8% have an increased obesity risk index. Significant negative correlations were obtained between the sports index and the body mass index, measures of skinfolds, body fat percentage, and hip circumference. The thigh skinfold showed a positive correlation with the college index and a negative correlation with the leisure time index. WHR and waist circumference showed no significant correlation with PA domains. Participants with higher values of subcutaneous adipose tissue are less likely to participate in activities of moderate and high intensity. The obtained results lead us to contemplate the importance of students’ life habits. Studying is a period of transition from adolescence to adulthood and is vital for acquiring healthy habits, especially in terms of increasing and maintaining PA and regulating body mass. In other words, students become more independent and responsible for personal choices in terms of health and well-being. Even though university enrollment changes students’ life habits such as moving, changing one’s diet, transport, abandoning organized PA, disproportionate time spent in sedentary and physical activities, and the availability of organized forms of exercise, we believe that it is necessary to monitor morphological characteristics and levels of PA and to continuously conduct education aimed at a healthy lifestyle. In particular, the need for education and intervention applies to faculties with a higher proportion of women.
References
Baecke, J. A., Burema, J., & Frijters, J. E. (1982). A short questionnaire for the measurement of habitual physical activity in epidemiological studies. The American Journal of Clinical Nutrition, 36(5), 936–942. DOI: 10.1093/ajcn/36.5.936
Besson, H., Ekelund, U., Luan, J., May, A. M., Sharp, S., Travier, N., ... & Peeters, P. H. (2009). A cross-sectional analysis of physical activity and obesity indicators in European participants of the EPIC-PANACEA study. International Journal of Obesity, 33(4), 497–506. doi: 10.1038/ijo.2009.25
Bowen, L., Taylor, A. E., Sullivan, R., Ebrahim, S., Kinra, S., Radha Krishna, K. V., ... & Kuper, H. (2015). Associations between diet, physical activity and body fat distribution: a cross sectional study in an Indian population. BMC Public Health, 15, 281. doi: 10.1186/s12889-015-1550-7
Bradbury, K. E., Guo, W., Cairns, B. J., Armstrong, M. E., & Key, T. J. (2017). Association between physical activity and body fat percentage, with adjustment for BMI: a large cross-sectional analysis of UK Biobank. BMJ open, 7(3). doi: 10.1136/bmjopen-2016-011843
Bray, G. A., & Gray, D. S. (1988). Obesitiy: Part I - Pathogenesis. West Journal of Medicine, 149(4), 429–441.
Buchowski, M. S., Townsend, K. M., Chen, K. Y., Acra, S. A., & Sun, M. (1997). Energy expenditure determined by self-reported physical activity is related to body fatness. Obesity Research, 7(1), 23–33. DOI: 10.1002/j.1550-8528.1999.tb00387.x
Calling, S., Hedblad, B., Engstrom, G., Berglund, G., & Janzon, L. (2006). Effects of bodyfatness and physical activity on cardiovascular risk: risk prediction using the bioelectrical impedance method. Scandinavian Journal of Public Health, 34(6), 568–75. DOI: 10.1080/14034940600595621
Cameron, A. J., Magliano, D. J., Shaw, J. E., Zimmet, P. Z., Carstensen, B., Alberti, K. G., ... & Söderberg, S. (2012). The influence of hip circumference on the relationship between abdominal obesity and mortality. International Journal of Epidemiology, 41(2), 484–494. doi: 10.1093/ije/dyr198
Correa-Rodriguez, M., Rueda-Medina, B., Gonzalez-Jimenez, E., & Schmidt-RioValle, J. (2017). Associations between body composition, nutrition, and physical activity in young adults. American Journal of Human Biology, 29(1), 1–7. DOI: 10.1002/ajhb.22903
Doymaz, F., & Cavlak, U. (2007). Relationship between thigh skinfold measurement, hand grip strength, and trunk muscle endurance: differences between the sexes. Advances in therapy, 24(6), 1192–1201. doi: 10.1007/BF02877765
Du, H., Bennett, D., Li, L., Whitlock, G., Guo, Y., Collins, R., ... & China Kadoorie Biobank Collaborative Group (2013). Physical activity and sedentary leisure time and their associations with BMI, waist circumference, and percentage body fat in 0.5 million adults: the China Kadoorie Biobank study. The American Journal of Clinical Nutrition, 97(3), 487–496. doi: 10.3945/ajcn.112.046854
Eliakim, A., Burke, G. S., & Cooper, D. M. (1997). Fitness, fatness, and the effect of training assessed by magnetic resonance imaging and skinfold-thickness measurements in healthy adolescent females. The American Journal of Clinical Nutrition, 66(2), 223–231. DOI: 10.1093/ajcn/66.2.223
Harmouche-Karaki, M., Mahfouz, M., Mahfouz, Y., Fakhoury-Sayegh, N., & Helou, K. (2020). Combined effect of physical activity and sedentary behavior on body composition in university students. Clinical Nutrition, 39(5), 1517–1524. doi: 10.1016/j.clnu.2019.06.015
Heimer, S., Mišigoj-Duraković, M., Ružić, L., Matković, B.R., Prskalo, I., Beri, S., ... & Tonković-Lojović, M. (2004). Fitness level of adult population in the Republic of Croatia estimated by EUROFIT system. Collegium Antropologicum, 28(1), 223–233.
Hrvatski zavod za javno zdravstvo HZJZ (2021). Pristupljeno https://www.hzjz.hr/sluzba-promicanje-zdravlja/gotovo-dvije-trecine-odraslih-osoba-u-hrvatskoj-ima-prekomjernu-tjelesnu-masu-ili-debljinu/ [22.09.2022]
Jackson, A. S., & Pollock, M. L. (1985). Practical assessment of body composition. The Physician and Sportsmedicine, 13(5), 76–90. doi: 10.1080/00913847.1985.11708790
Lee, W. S. (2016). Body fatness charts based on BMI and waist circumference. Obesity, 24(1), 245–9. DOI: 10.1002/oby.21307
Lohman, T. G., Ring, K., Pfeiffer, K., Camhi, S., Arredondo, E., Pratt, C., ... & Webber, L. S. (2008). Relationships among fitness, body composition, and physical activity. Medicine and Science in Sports and Exercise, 40(6), 1163–1170. doi: 10.1249/MSS.0b013e318165c86b
Medved, R., Janković, S., & Ivanek, M. (1992). Morfološke osobitosti studenata kineziologije. Kineziologija, 24(1-2), 24–26.
Miežienė, B., Šiupšinskas, L., & Jankauskiene, R. (2018). Relationships between sport, work and leisure-time physical activity among Lithuanian University students. Baltic Journal of Sport and Health Sciences, 2(81), 24–30. doi: 10.33607/bjshs.v2i81.327
Mišigoj-Duraković, M., Ružić, L., Heimer, S., Prskalo, I., Matković, B.R., & Babić, Z. (2001). Active vs. inactive population according to body size, body composition and functional abilities. In M. Bartoluci, S. Heimer i L. Ružić (Eds.), Proceedings of the 2nd CESS Conference “Sport for All-Health-Tourism”, (pp. 148-152). Zagreb: Faculty of physical education, University of Zagreb.
Mraković, S. (2011). Antropološka obilježja studentica različitih studijskih programa. (Magistarski rad). Zagreb: Kineziološki fakultet Sveučilišta u Zagrebu.
O'Connor, T. E., & Lamb, K. L. (2003). The effects of Bodymax high-repetition resistance training on measures of body composition and muscular strength in active adult women. Journal of Strength and Conditioning Research, 17(3), 614–620. DOI: 10.1519/1533-4287(2003)017<0614:teobhr>2.0.co;2
Orsini, N., Bellocco, R., Bottai, M., Pagano, M., & Wolk, A. (2007). Correlates of total physical activity among middle-aged and elderly women. The International Journal of Behavioral Nutrition and Physical Activity, 4, 16. doi: 10.1186/1479-5868-4-16
Prendl, D. (2014). Odnos kvalitete života i tjelesne aktivnosti u funkciji dobi. (Diplomski rad). Osijek: Filozofski fakultet Sveučilište Josipa Jurja Strossmayera u Osijeku. https://repozitorij.ffos.hr/islandora/object/ffos:1265
Seidell, J. C., Pérusse, L., Després, J. P., & Bouchard, C. (2001). Waist and hip circumferences have independent and opposite effects on cardiovascular disease risk factors: the Quebec Family Study. The American Journal of Clinical Nutrition, 74(3), 315–321. doi: 10.1093/ajcn/74.3.315
Siri, W. E. (1956). The gross composition of the body. Advances in biological and medical physics, 4, 239–280. doi: 10.1016/b978-1-4832-3110-5.50011-x
Stephens. T., Jacobs, D. R. & White, C. C. (1985). A descriptive epidemiology of leisure-time physical activity. Public Health Reports, 100(2), 147–158.
World Health Organization (WHO) (2008). Waist circumference and waist-hip ratio: report of a WHO expert consultation. Retrieved https://www.who.int/publications/i/item/9789241501491
[05.03.2022]
World Health Organization (WHO) (2021). Overweight and obesity report fact sheet /online/. Retrieved https://www.who.int/news-room/fact-sheets/detail/obesity-and-overweight [05.03.2022]
Yang, X., Telama, R., Viikari, J., & Raitakari, O. T. (2006). Risk of obesity in relation to physical activity tracking from youth to adulthood. Medicine and Science in Sports and Exercise, 38(5), 919–925. doi: 10.1249/01.mss.0000218121.19703.f7
You, H. W., Tan, P. L., & Mat Ludin, A. F. (2020). The relationship between physical activity, body mass index and body composition among students at a Pre-University Centre in Malaysia. International Medical Journal Malaysia, 19(2), 83-88. doi: 10.3390/healthcare8040570
Yurdakul, H., & Baydemir, B. (2020). Comparison of physical activity and skinfold thickness of students living in rural and city center. Pedagogy of Physical Culture and Sports, 24(5), 271–277. doi: 10.15561/26649837.2020.0508
Zanovec, M., Lakkakula, A. P., Johnson, L. G., & Turri, G. (2009). Physical activity is associated with percent body fat and body composition but not body mass index in white and black college students. International Journal of Exercise Science, 2(3), 175–185.
|
|
2nd International Scientific and Art Faculty of Teacher Education University of Zagreb Conference Contemporary Themes in Education – CTE2 - in memoriam prof. emer. dr. sc. Milan Matijević, Zagreb, Croatia |

Povezanost morfoloških karakteristika i tjelesne aktivnosti studentica Učiteljskog fakulteta |
Sažetak |
|
Cilj ovoga istraživanja bio je utvrditi postoji li povezanost morfoloških sastavnica fitnesa s razinom tjelesne aktivnosti studentica Učiteljskog fakulteta u Čakovcu. Uzorak ispitanika činilo je 146 studentica prve godine redovnoga i izvanrednoga studija. Uzorak varijabli sastajao se od osam antropometrijskih mjera i Baeckeova upitnika tjelesne aktivnosti. Izračunati su Spearmanovi koeficijenti korelacije između tjelesne aktivnosti i antropometrijskih mjera (indeks tjelesne mase, kožni nabor nadlaktice, kožni nabor suprailiokristalni, kožni nabor bedra, postotak tjelesne masti, opseg trbuha, opseg bokova i indeks rizičnosti tipa pretilosti). Rezultati su pokazali da je veliki postotak studentica normalne tjelesne mase od 75,9 %, međutim, zabrinjava postotak od 24,1 % povećane tjelesne mase i pretilosti. Rezultati također pokazuju da 91,7 % studentica ima normalni indeks rizičnosti tipa pretilosti, dok samo 8,3 % ima povećani indeks. Deskriptivnim parametrima Baeckeova upitnika najveća prosječna vrijednost postignuta je u području slobodnoga vremena, manja je u području sporta, dok je najmanja prosječna vrijednost tjelesne aktivnosti postignuta na fakultetu. Spearmanovi koeficijenti korelacije između morfoloških varijabli i tjelesne aktivnosti ukazuju na niske negativne vrijednosti u svim morfološkim varijablama osim u opsegu trbuha. Varijabla indeks slobodno vrijeme pokazuje značajnu negativnu korelaciju samo s kožnim naborom bedra. Slaba negativna povezanost dobivena je između ukupne tjelesne aktivnosti i indeksa tjelesne mase, kožnoga nabora nadlaktice, kožnoga nabora bedra, postotka tjelesne masti i opsega bokova. |
|
Ključne riječi |
|
Baeckeov upitnik tjelesne aktivnosti; morfološke sastavnice; tjelesna aktivnost |